

Article by Lawrence Dean, Regional Director, Zonda Intelligence

Back in 2005 and 2006, I was a land acquisition manager for the Houston division of one of the finest privately held homebuilders that is unfortunately no longer with us. That was before my career pivot to, as my eight-year-old son says, “counting all of the houses and then going around and telling everyone how many houses I counted.” Pretty accurate…out of the mouths of babes as they say.
In those heady 2005 to 2007 days, we were building and selling a ton of homes. Metrostudy (since rebranded to Zonda) observed right at 50,000 annual new home starts in the twelve-month period ending in each of 1Q, 2Q, and 3Q 2006. Builders were enjoying strong margins on all of these home sales, even in a market where the median home price was still around $150,000.
Advertisement
In spite of how good things were, homebuilding leaders were still quite nervous about current operating conditions. More and more homes sold were being purchased with exotic zero money down, low doc or no doc mortgages. Many of the buyers had little to no home equity, and little cash reserves in case of a rainy day. The situation did not seem sustainable. Hindsight is always 2020, and of course we now know that it was not a sustainable situation at all. Less than two years later we saw the Great Recession and related financial crisis grip not just our industry but the nation as a whole.
This history provides a backdrop for the question that we at Zonda are probably asked the most: how does the current high volume, cycle peak market, differ from that of 2006 and 2007? How is it different this time? Or is it even different this time at all?
Short answer: this time is very different. There are two key overall reasons why this is the case.
- New home and lot supply is significantly more constrained now versus then.
- New home demand is demographics driven and not aided by artificial subprime mortgage driven growth.
The table below summarizes seven key metrics as they were at the end of 2020 versus the end of 2006.
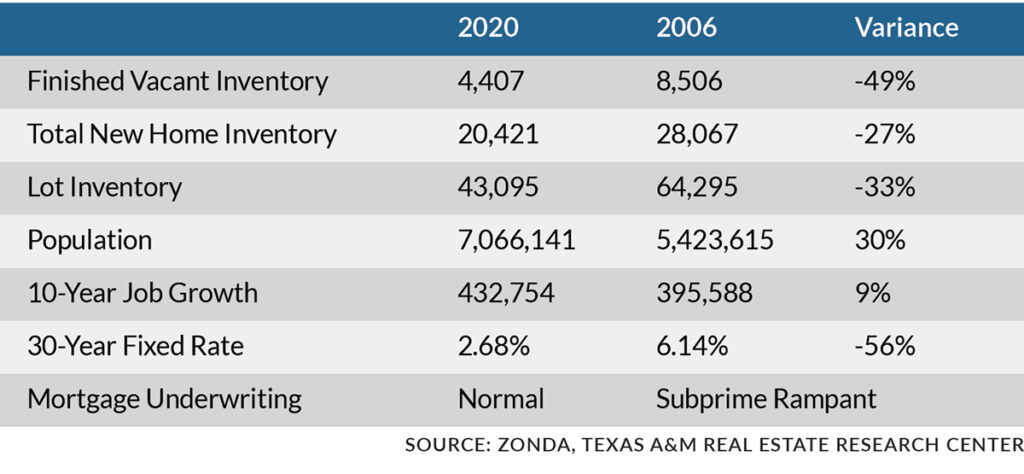
Each one of these seven metrics offer visibility into just how different the current boom market is from those go-go subprime mortgage days of the past.
Finished Vacant Home Inventory: When Zonda performs its field survey (the going out and counting houses part) each quarter, we refer to any new home that appears to be complete but is not yet occupied as Finished Vacant. This number ties very closely to the amount of completed spec inventory a builder has. At the end of 2020, Zonda counted 49% fewer Finished Vacant homes than Metrostudy did at the end of 2006. Reduced inventory.
Total New Home Inventory: Metrostudy and now Zonda consider the following three types of new homes to be homes in inventory:
- All active model homes
- All homes under construction regardless of started as specs or dirt sales
- All Finished Vacant homes as discussed above
The total new home inventory made up of those three types of homes at the end of 2020 is down 27% from what it was at the end of 2006. Again, reduced inventory for the market to contend with.
Lot Inventory: Now if you ask most builders, this is not a good thing. The inventory of vacant developed lots (VDL), which in Zonda-speak are completely developed lots on which a builder has not yet started a home, is the lowest it has been in the entire time Metrostudy and now Zonda has served the market.
VDL inventory in Houston is seen as being at equilibrium if there are 20 to 24 months of lot inventory on hand. The end of 2020 saw a scant 14.1 months of supply. By the end of Q1 2021, this inventory level further slid to a record low 12.8 months of supply. That tight 14.1 months of supply (and 43,095 vacant lots) from 2020 year’s end represents a 33% decline from the number of VDL observed at the end of 2006.
Population and Job Growth: In 2006, the Houston MSA had a population of 5.4 million residents. In that same year the market saw right at 50,000 annual new home starts. By 2020, the same Greater Houston region had grown to nearly 7.1 million residents. However, our industry spread “just” 36,750 annual new home starts over a region whose population was now 30% greater than it was back in 2006.
While 2020’s home starts volume represents a peak thus far this cycle, the number of home starts per capita is much lower in 2020 than it was back in 2006. This contributes to the more sustainable overall market conditions of 2020 versus the 2006 peak. The Houston region has also seen greater job growth in the decade leading up to 2020 versus the 10 years leading to 2006, further bolstering demand.
Mortgage Underwriting and Interest Rates: It goes without saying that the record low interest rates that the market has enjoyed for the last 12 months have aided new home demand. The median 30-year fixed rate at the end of 2020 (which has since increased slightly) was 56% lower than the same median rate at the end of 2006. And mortgage underwriting in the current environment can be characterized as normal or typical. That was certainly not the case in the subprime mortgage era of 2006.
Wrapping all of these thoughts up, the current high volume new home market is built on much more solid fundamentals than the market was the last time this many new homes were being sold and built in the Houston market.
Builders have plenty to worry about in the current environment: raising lumber prices, shrinking affordability, evolving land development regulations in various cities and counties, appraisal issues, material availability, increased cycle times, and so, so much more. However, one thing we as an industry likely need not worry about is this current boom cycle exploding into a housing bust as we saw back in 2008 and 2009.
We simply don’t have enough homes under construction or lots to build them on to get ourselves in trouble. And the majority of new homebuyers currently have sufficient credit, equity, and other resources to avoid a foreclosure or distress sale should their situation change for the worse.